 This is my first draft which o quarter of the page and the months are on top of the actual data which was wrong so I changed it to make it look better and easier to read.
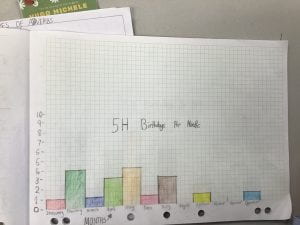 This is my second draft which is on a full page not just a quarter of the page like my first draft was.
 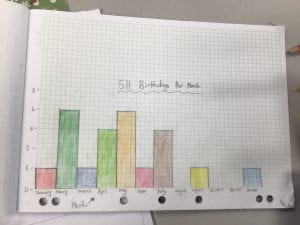 This is my final copy of my graph and I made the numbers more spaced out than my second draft which made the data of the graph more longer which makes it look better and fill up the page more.